Pakjira Itthisang

Hello! I'm Pakjira Itthisang, but you can call me Fern.

Product Designer & Interaction Designer & Creative Technologist

I’m a multidisciplinary product designer creating intuitive digital experiences from complex systems, data, and emerging technologies. My work spans UX/UI, interaction design, data visualization, and creative technology, with a focus on transforming complex information and user needs into clear, meaningful experiences.

Skills

My background in architecture, data visualization, and computational design shapes how I approach product design at both the user and system level. I work across research, user journeys, information architecture, interaction design, prototyping, and visual systems—connecting user needs, technology, and design to create thoughtful and scalable experiences.

Research & Strategy

User research · Interviews & surveys · Persona & journey mapping · Design research methods · Community-focused design

UX/UI Design

Wireframing · Prototyping · Information architecture · Inclusive & responsive design · Design systems

Product & Interaction Design

Application design · Interactive storytelling · Gamification · Cross-disciplinary collaboration · Human–AI interaction

Data Viz & Computational Design

Data storytelling · Dashboard design · Algorithmic design · Spatial computing · Parametric modeling (Grasshopper, Rhino)

Projects

I design applications, platforms, and interactive systems that merge UX/UI, product design, and data visualization. My work spans startups, research labs, and global initiatives, creating user-centered, data-driven, and scalable digital solutions.

Thai AMR watch Dashboard

Thai AMR Watch Dashboard

Product Design UX/UI DesignDesign SystemResponsive StorytellingInteractiveData VizDashboard

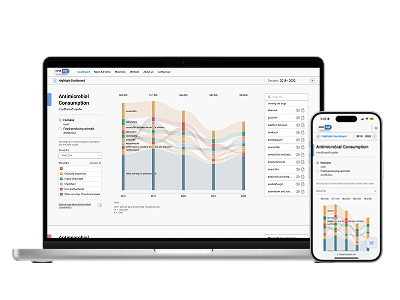
A data visualization website requested by IHPP to present antimicrobial consumption, resistance, and public awareness in Thailand. A clear, self-navigable interface makes complex health research accessible to non-medical audiences.
Dangerous Speech in Thailand

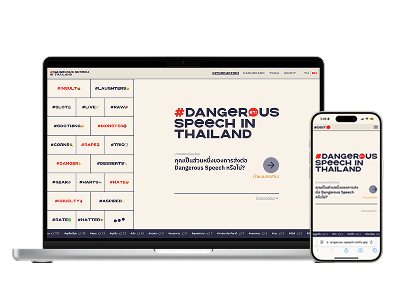
Dangerous Speech in Thailand

Product Design UX/UI DesignResponsive Data VizStorytellingInteractive

A data storytelling website that surfaces harmful words used online in Thailand, powered by Zocial Eye social-listening. It focuses on three issues: Protection of Thai Buddhism, Violent conflict in the southern border provinces, and Culture promoting violence. Includes an interactive quiz to encourage reflection on online language.

South Sukhumvit

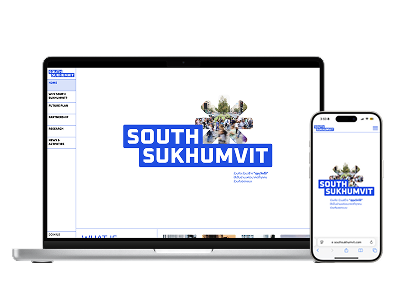
South Sukhumvit

Product Design UX/UI DesignResponsive Design SystemCommunity Engagement

A digital platform that supports urban planning and community dialogue in Bangkok’s South Sukhumvit district. Designed inclusive and accessible interfaces to help residents, government, and investors share ideas, collaborate, and shape the district’s transformation into a Cyber Tech hub.

15 Minutes Pocket Park

15 Minutes Pocket Park

UX/UI DesignResponsive Data VizInteractive

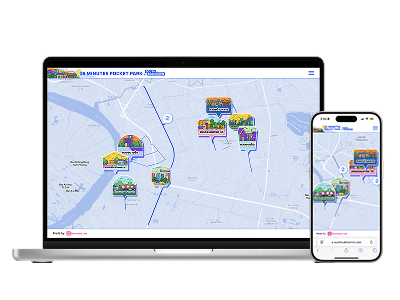
The 15 Minutes Pocket Park is a project that explores the concept of creating a 15-minute pocket park in Bangkok, Thailand. The project visualizes the data to show the most popular parks, the busiest times of day, and the most popular routes. The visualization is created using the D3.js library and the data is sourced from the Bangkok Open Data Portal.

The Citibike Manhattan Exploration

The Citibike Manhattan Exploration

Case Study UX/UI Design Data VizAPI Integration Interactive

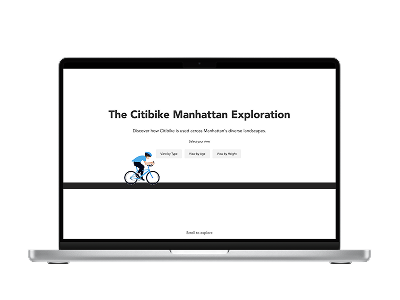
This is a data visualization project that explores the Citibike bike-sharing system in Manhattan, New York City. The project visualizes the bike trips data to show the most popular bike stations, the busiest times of day, and the most popular routes. The visualization is created using the D3.js library and the data is sourced from the Citibike API.

The Earth Quake

The Earth Quake

Case Study Product Design UX/UI DesignResponsive Data VizAPI Integration Interactive

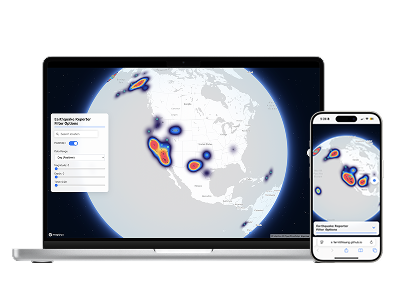
The Earth Quake is an interactive web experience that transforms complex earthquake data into an accessible and explorable digital product. I designed the experience from information architecture and user flows to responsive interfaces and interactive data visualizations, focusing on how users can navigate, interpret, and make sense of large-scale seismic data across different levels of detail.

Artsips

Artsips

Case Study Product Design UX/UI DesignInteractive Storytelling Data Viz

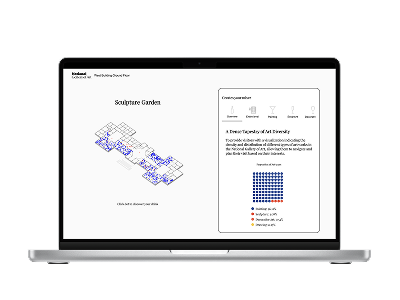
ArtSip transforms art museum experiences by merging art appreciation with mixology. It offers a virtual tour of the National Gallery of Art, inviting users to craft custom drinks inspired by artworks. Each painting’s palette inspires unique cocktail recipes, merging education, art, and playful interaction.

Turtle Guardian

Turtle Guardian

Case Study UX/UI DesignData VizInteractive

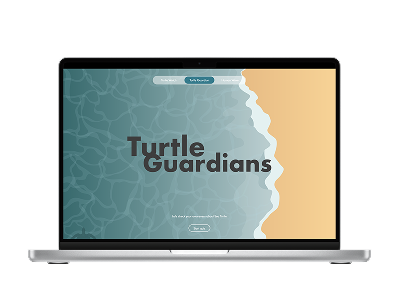
This website raises awareness about sea turtle conservation in Thailand through interactive storytelling. It features Turtle Guardian, a quiz that teaches protection strategies; Turtle Watch, a dashboard of nesting data (2020–2022); and Human Wave, an analysis of 4,000+ Thai social media posts. Together, these tools highlight threats like plastic waste while inspiring education and collective action.

Turtle Guardian

Documenting Protest Symbols

Case Study UX/UI DesignData VizInteractive

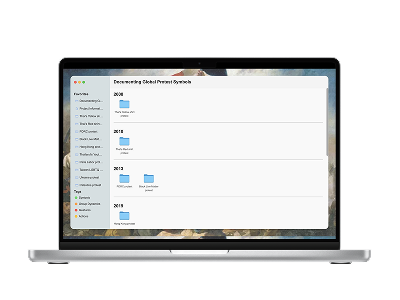
This project examines how protest symbols evolve as social movements grow. It documents their origins, tracks how they spread, and analyzes how meanings shift across different contexts. By mapping these transformations, the project reveals how symbols visually communicate collective action and continue to inspire solidarity.

Companion, Cohabitant and Continuum (Cee)

Companion, Cohabitant and Continuum (Cee)

Case Study Computational DesignInteraction Storytelling Human–AI

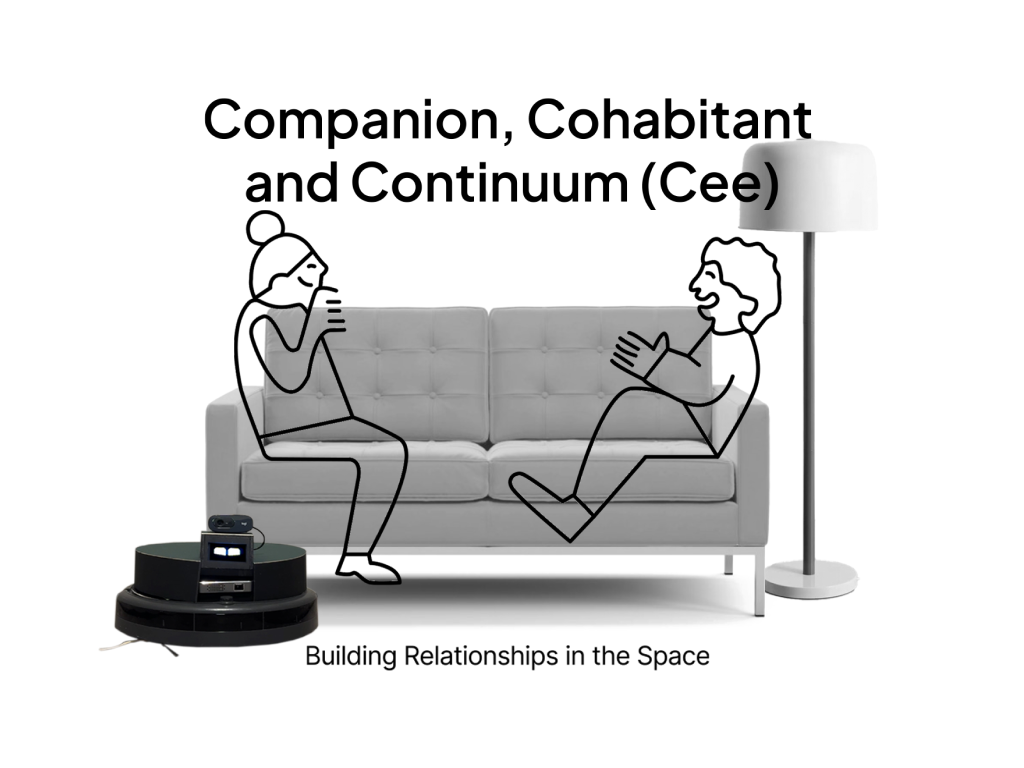
Cee is more than a robotic vacuum—it acknowledges cultural perspectives on cleaning. Designed as a living companion, it adapts across four personas (Butler, Fortuneteller, Therapist, Cleaner), engaging emotionally and culturally with its environment, linking cleanliness to well-being, fortune, and harmony.

Contact